

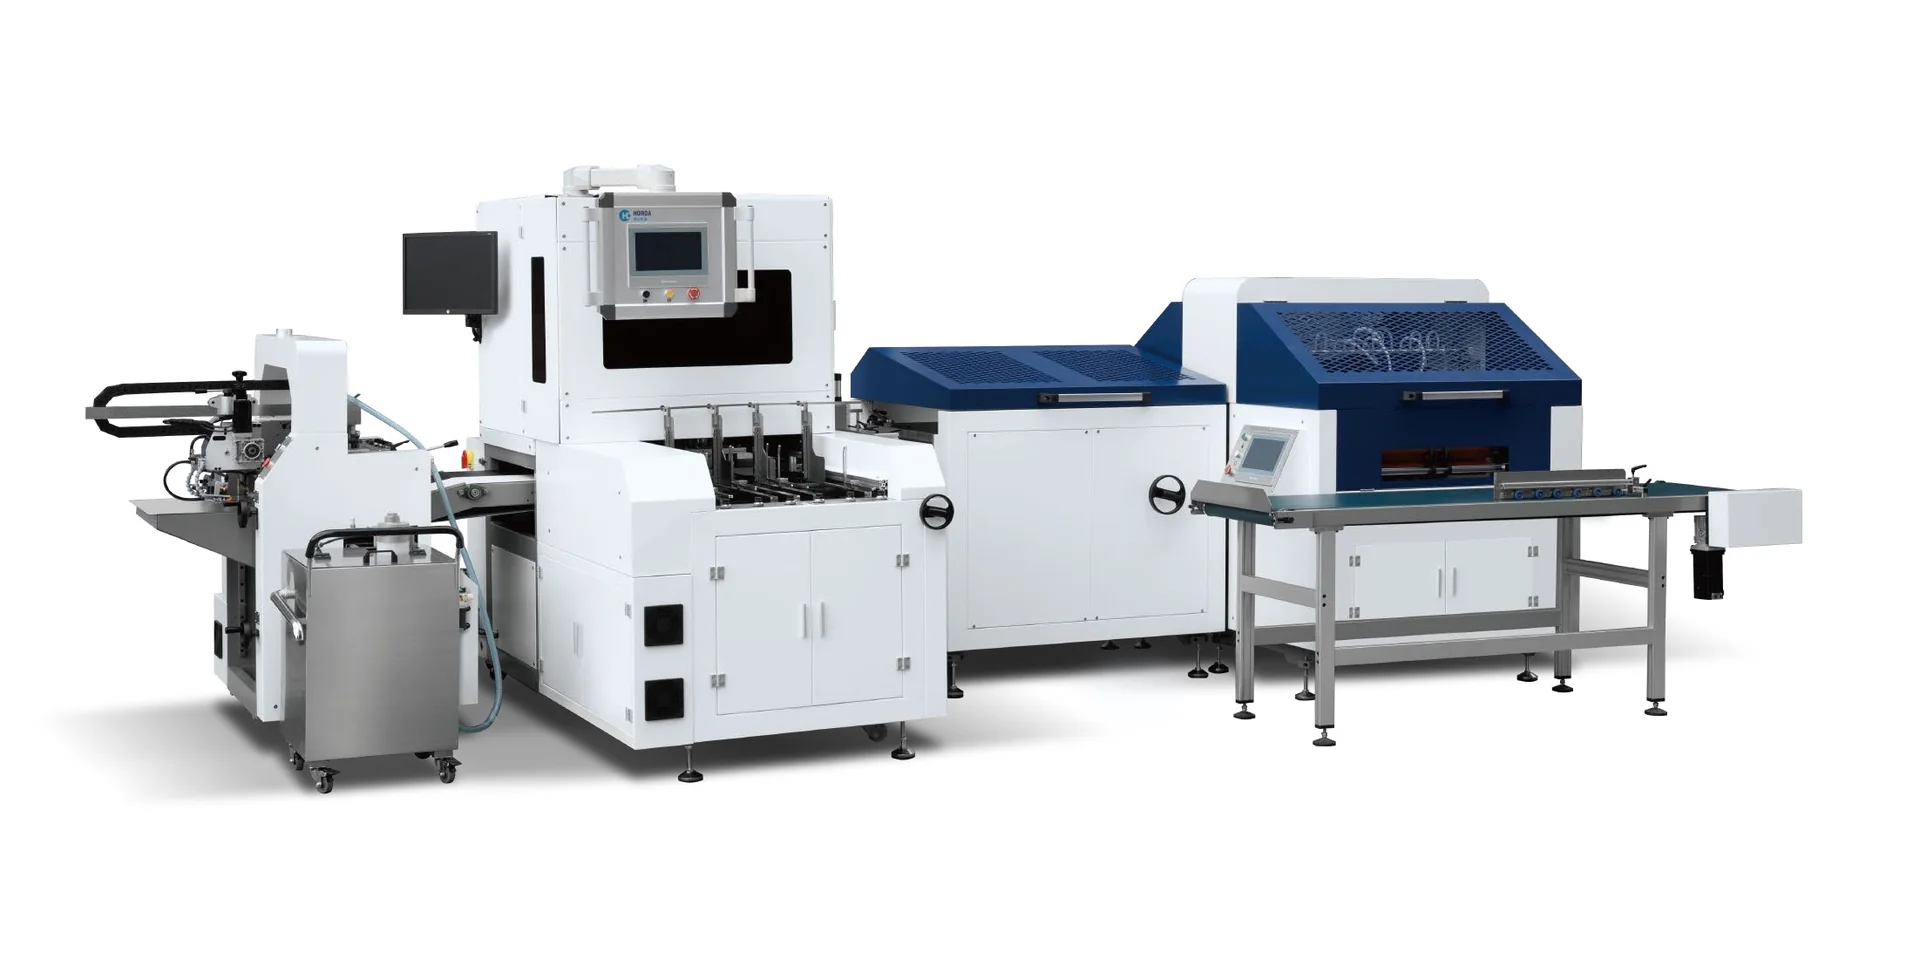
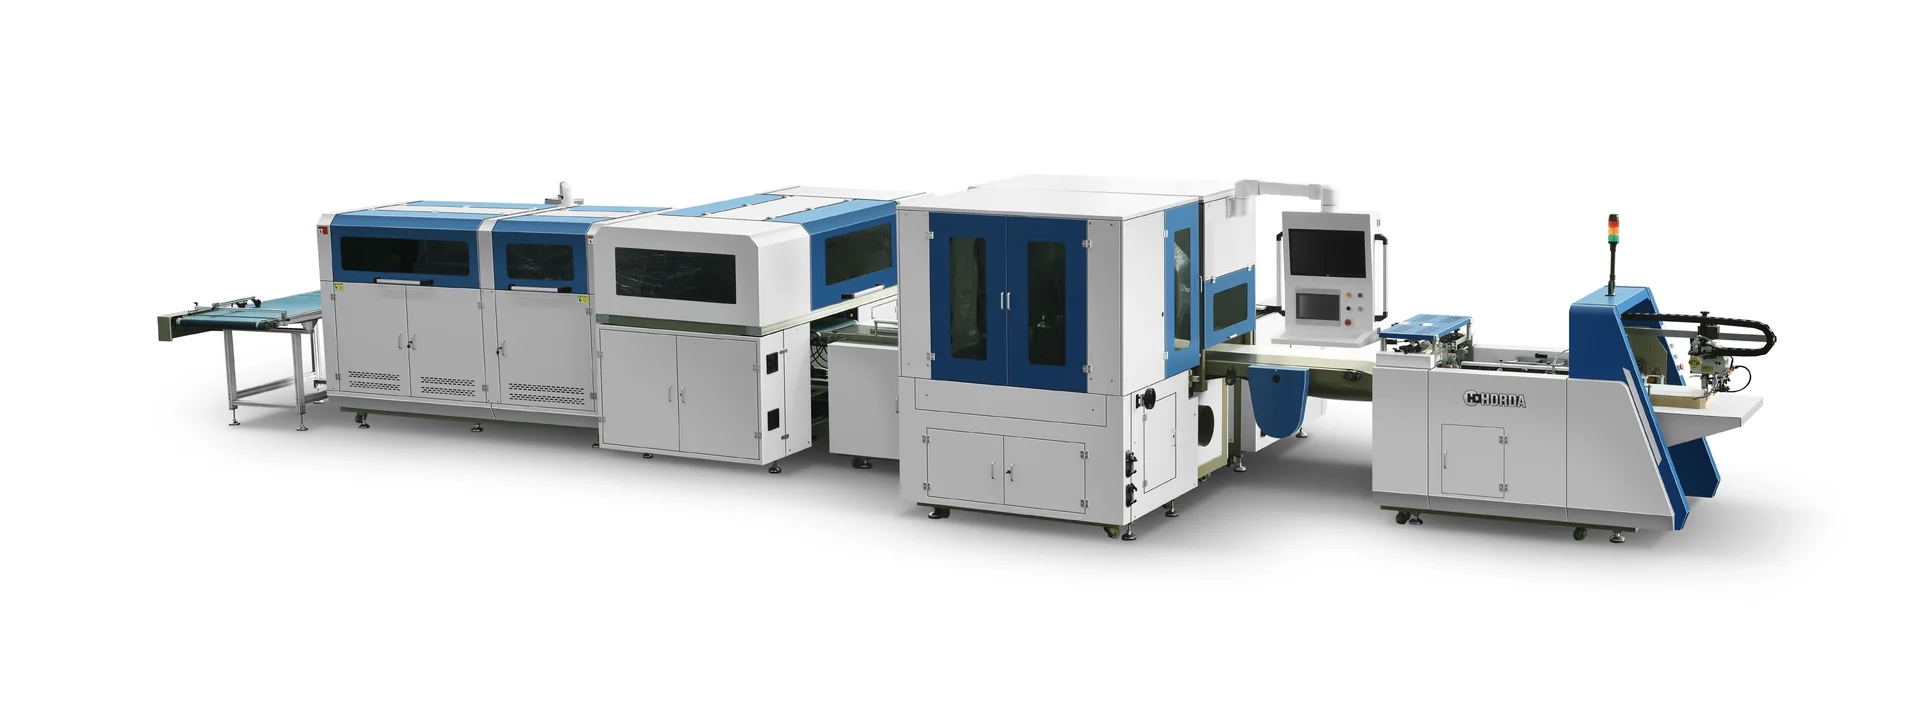
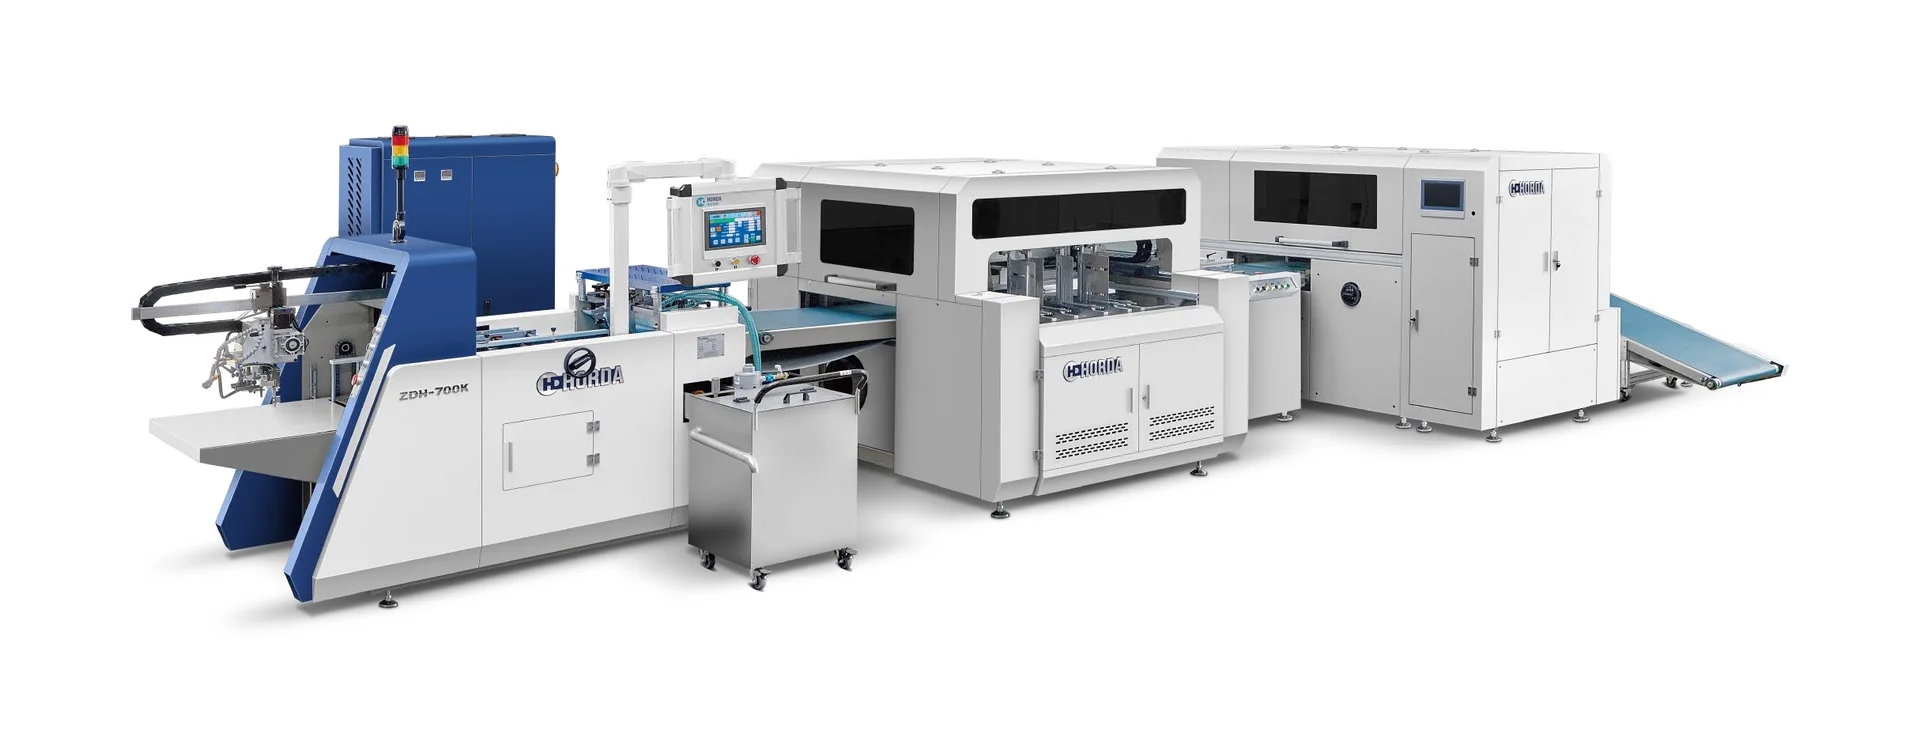
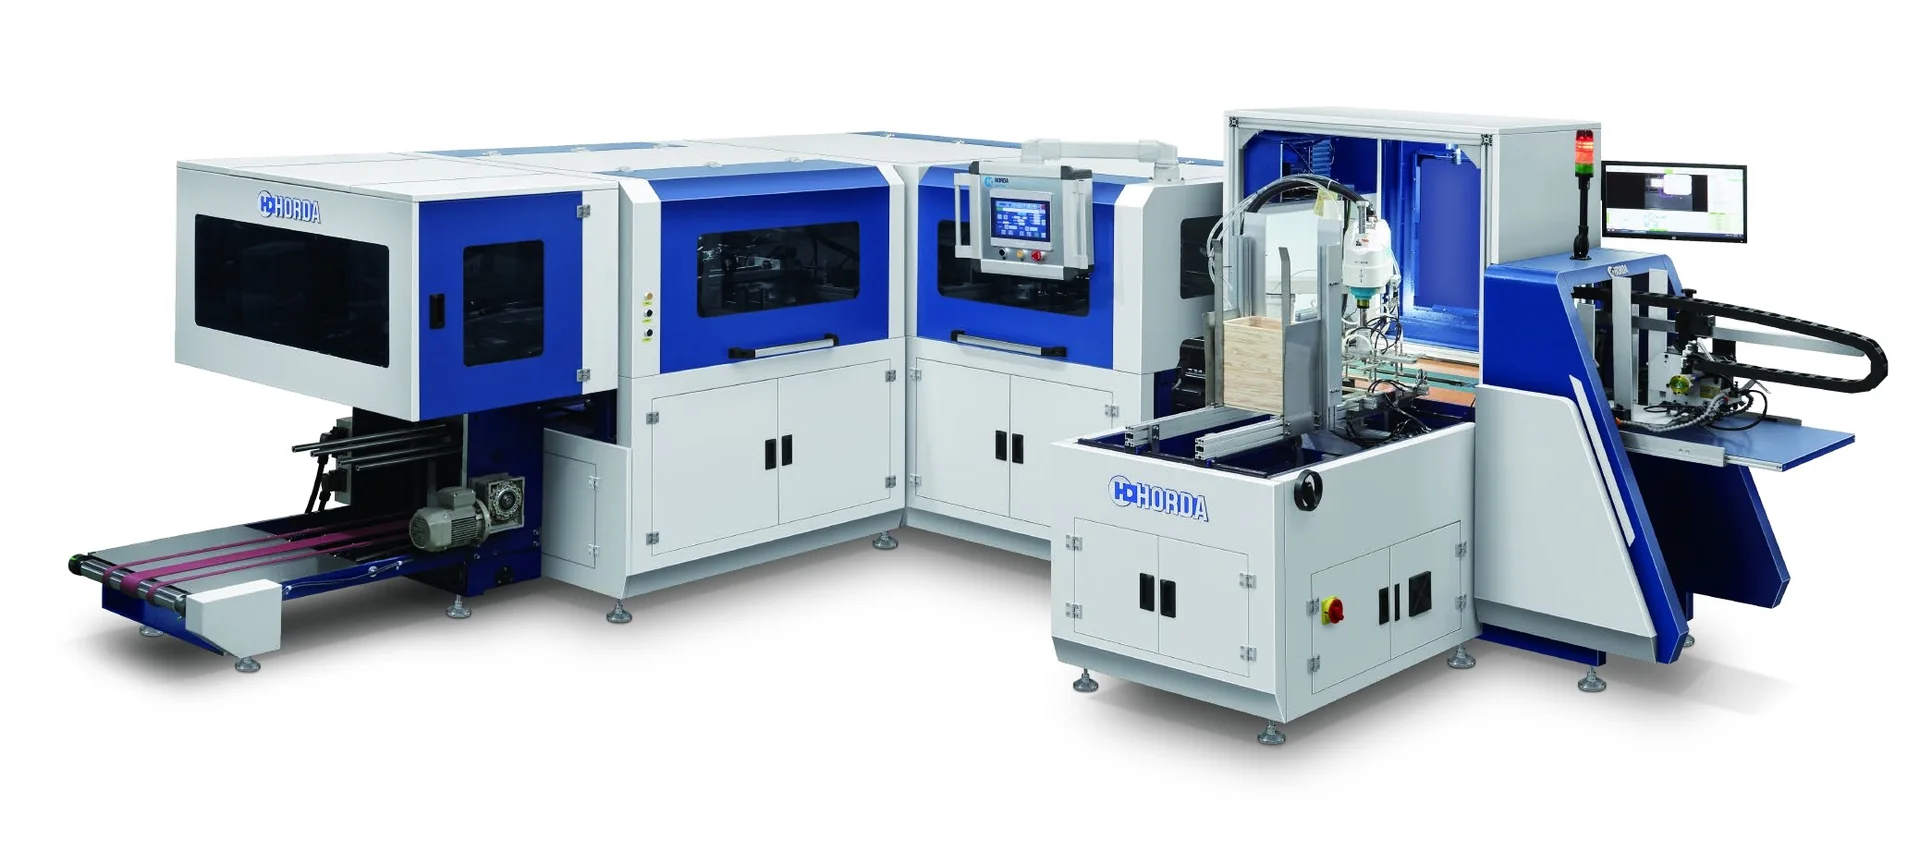
A packaging machine with the lowest purchase price is not automatically the lowest-cost machine to own. A useful total cost of ownership comparison puts every shortlisted machine on the same production horizon and then compares acquisition cost, labor, material loss, maintenance and service, downtime exposure, and any other costs that materially differ between the alternatives.
The important part is not building the longest spreadsheet. It is making sure that the numbers are comparable. If one quotation assumes one operator and another assumes a complete line crew, or one supplier quotes rated speed while another provides accepted production data, the resulting TCO comparison may look precise while answering the wrong question.
For machinery procurement, a practical TCO framework can be expressed as:
This is a comparison framework, not a mandatory universal formula. Individual projects may require additional or fewer cost rows. The critical rule is that every machine must be evaluated with the same cost boundary, production assumptions and evidence standard.
Start With One Common Production Scenario Before Comparing Cost
Before entering labor rates, spare parts or waste percentages, define the production job that every shortlisted machine is expected to perform.
At minimum, the comparison should establish the same study period, required accepted output, operating schedule where relevant, product or job mix, and the boundary of the equipment being compared. A single machine should not be compared economically with a multi-machine line unless the difference in scope is made explicit and separately costed.
The distinction between rated speed and accepted production output is especially important. Rated or catalogue speed describes a machine capability under defined conditions; it does not by itself establish the number of conforming products a plant will receive during a shift. Availability loss, realized running speed and first-pass quality loss can all change the amount of good output available for sale or downstream processing.
That does not mean a buyer should invent an arbitrary utilization factor. If sustained accepted output has not been demonstrated for the planned materials and job conditions, mark it as unconfirmed and define how it will be validated—for example through documented production data, an agreed material trial or an appropriate acceptance test.
The same discipline applies to job mix. A line producing one format for long runs may have a different economic profile from the same equipment handling frequent size or material changes. Changeover should therefore enter the comparison only when it is material to the buyer’s real production schedule.
A TCO worksheet is only meaningful after these assumptions are aligned.
If two alternatives are expected to deliver different amounts of accepted output, first confirm that each can meet the same production requirement. As a secondary normalization, you can then compare ownership cost to accepted good units:
Use accepted good units—not catalogue units—in that denominator. This is a supplementary comparison metric, not a substitute for confirming required capacity. If accepted output has not been demonstrated, model a range and flag the result as assumption-dependent rather than presenting a single precise cost per unit.
Build the TCO Model: Price Is Only the First Row
Purchase price is the most visible number in a machinery quotation, but it is only one part of the ownership decision.

A useful comparison normally separates cost into categories so that the same expense is not counted twice:
| Cost category | What to compare |
|---|---|
| Acquisition and configuration | Machine or line scope, options, tooling and included modules |
| One-time project costs | Installation, commissioning, training, logistics or other applicable startup items |
| Labor | Staffed hours and tasks multiplied by the buyer’s own labor-cost basis |
| Material loss | Setup loss, rejects and rework using a consistent measurement basis |
| Maintenance and spares | Planned maintenance, replacement parts and relevant consumables |
| Controls/software lifecycle | Replacement availability, supported software/firmware versions and any documented upgrade or conversion path for controls that may become obsolete |
| Service | Chargeable support, travel or other responsibilities where confirmed in writing |
| Downtime exposure | Buyer-defined economic scenario or validated production history |
| Other operating costs | Utilities, tooling/change parts or other material project-specific differences |
| End-of-horizon value | Residual or disposal value only where it is relevant and reasonably supportable |
Not every project needs every row. If electricity consumption is similar and economically immaterial, adding an elaborate energy model may not improve the decision. If materials are expensive and reject levels differ materially, material loss may deserve much more attention.
The comparison should therefore follow decision impact, not spreadsheet complexity.
For longer study periods, companies may also choose to account for the timing of future cash flows. If present-value methods are used, the same financial convention should be applied to every alternative. The article should not prescribe a universal discount rate; that is a buyer-specific financial assumption.
Compare Labor From Actual Staffing and Tasks—not the Automation Label
Terms such as automatic or fully automatic are not enough to calculate labor cost.
The relevant question is: What work must people actually perform during the planned production scenario?
The tasks that matter depend on the configuration. They may include normal machine operation, loading and unloading, material preparation, inspection, cleaning, setup, changeover and intervention. A machine that reduces one manual operation may still require labor elsewhere in the process, so staffing needs should be evaluated at the correct system boundary.
This is also why single-machine staffing and complete-line staffing must not be mixed. A quotation describing an automated module may not describe the people required upstream or downstream.
For supplier-specific labor claims, buyers should ask what the staffing figure actually represents:
- Which machine or complete line is included?
- Which operations are inside the labor count?
- What product and material were running?
- Does the number describe normal production only, or also loading, inspection and changeover?
- Is it a documented configuration, a trial observation or only a planning estimate?
If those conditions are unknown, the labor number can still be modeled as a scenario, but it should be labeled as an assumption rather than presented as a demonstrated saving.
This distinction matters because labor economics scale with operating time. A staffing difference that appears small per shift may matter over a high-utilization project, while the same difference may be economically minor in intermittent production.
Turn Waste and Rejects Into a Cost You Can Compare
Material loss is another area where apparently simple percentages can create misleading comparisons.
A supplier might report a reject percentage, a buyer might track scrap by material weight, and another plant might record rework separately. Those values cannot be placed in one TCO worksheet until the measurement basis is aligned.
Where relevant, separate at least three mechanisms:
Setup or startup loss occurs while the process is being established for a job.
Production rejects are inputs that do not become accepted finished products.
Rework may preserve part of the material value but consume additional labor, machine time or material.
A practical material-loss model therefore needs both a quantity basis and an economic basis. For example, the buyer may calculate the cost of material that does not become accepted output and add separately identifiable rework costs when doing so avoids double counting.
The quality definition must also remain consistent. First-pass good output is different from a unit that eventually becomes acceptable after rerun, repair or rework. If the business values those outcomes differently, the TCO model should preserve that distinction.
Supplier-specific claims that a machine produces less waste require evidence appropriate to the project. A material trial or acceptance test can be useful, but the measurement method should be agreed in advance: material type, job length, startup treatment, reject definition and acceptance criteria can all influence the result.
Without a common basis, “2% waste” and “3% waste” may describe different things.
Compare Service and Downtime Without Inventing Uptime
Service affects ownership cost in two different ways: through the direct cost of maintenance and support, and through the consequences of lost production when equipment is unavailable.
Those two effects should not be collapsed into a vague “service quality” score.
For direct service cost, compare written inclusions and exclusions where they are relevant to the purchase:
- planned maintenance responsibilities;
- spare or wear parts included with the machine;
- chargeable parts and consumables;
- remote support arrangements;
- onsite technician charges where applicable;
- travel or freight responsibility;
- warranty scope and exclusions;
- responsibilities after the warranty period.
These are commercial terms, not assumptions that should be inferred from a manufacturer’s general reputation.
Downtime requires a different treatment. Unless reliable production history exists for the exact situation, a buyer should not assign an arbitrary uptime percentage to a machine. Instead, the buyer can define one or more downtime scenarios and ask whether the economic ranking changes.
The value of an hour of downtime is also buyer-specific. For one factory, it may represent lost contribution from a constrained line. For another, production may be recoverable on another shift or another machine. A useful TCO analysis therefore uses the buyer’s economic consequence rather than a universal cost-per-hour figure.
Warranty should not be treated as a substitute for this analysis. A warranty may define responsibility for particular parts or work, but it does not automatically make lost production cost zero.
For longer study periods, also consider controls and software lifecycle risk. Replacement availability for PLCs, HMIs, servo drives or other control components, supported software or firmware versions, and any documented upgrade or conversion path can affect future maintenance cost and recovery time. Treat future upgrade costs as assumptions unless the applicable supplier or project documentation confirms them.
Test the Result When Labor, Waste or Downtime Is Uncertain
A machinery investment rarely comes with perfect data. The solution is not to hide uncertainty; it is to test whether the uncertainty matters.
Sensitivity analysis asks a practical question:
If this input changes, does the preferred machine change?
Suppose one machine has a higher acquisition cost but is expected to require fewer staffed hours. Instead of inserting an optimistic labor-saving assumption and declaring a payback period, calculate the TCO across a reasonable range of staffed hours. If the more expensive machine remains favorable across that range, the decision is relatively robust. If a small change reverses the ranking, the labor assumption needs stronger validation before purchase.
The same method can be used for material loss or downtime.
Break-even analysis takes the idea one step further. Define an uncertain variable x and solve:
The resulting value is the point at which the economic decision changes.
For example, rather than asking, “Which supplier’s labor-saving claim should we believe?” the buyer can ask, “How many staffed hours would Machine B actually need to save for its higher acquisition price to break even over our study period?”
That is a much more actionable question because it converts an uncertain sales claim into a validation target.
Avoid false precision. If the underlying inputs are estimates, the output should not be presented with unnecessary decimal accuracy. A range or break-even point is often more useful than a single impressive-looking ROI number.
Common TCO Comparison Mistakes That Can Reverse the Decision
Several errors can make the apparently cheaper machine look better simply because the comparison basis is inconsistent.
Comparing different equipment scopes. One quotation may include tooling, auxiliary modules or downstream equipment that another excludes.
Using different production horizons. A five-year recurring cost estimate cannot be compared directly with a three-year estimate.
Treating rated speed as accepted output. Nominal machine speed does not automatically account for availability, quality loss or the actual production route.
Accepting labor-saving percentages without a staffing boundary. A percentage is difficult to use if the baseline crew, tasks and operating hours are unknown.
Comparing waste figures with different denominators. Scrap by sheet count, waste by material weight and first-pass rejects are not automatically equivalent.
Treating unknown values as zero. Missing maintenance, downtime or service information is uncertainty—not free ownership.
Double counting one loss. For example, the cost of a reject should not be counted once as wasted material and again as a complete lost-production value unless those are genuinely separate economic consequences.
Assuming warranty means zero service or downtime cost. Warranty scope and production loss are different issues.
Comparing a machine with a complete line. Labor, output and maintenance boundaries must match the actual equipment scope.
These are not claims about how frequently buyers make each mistake. They are control checks that prevent inconsistent assumptions from deciding the purchase.
Put the TCO Inputs and Evidence Side by Side Before You Choose
The final TCO worksheet should show more than numbers. It should show where each number came from.
A practical comparison record can use the following structure:
| Input | Common comparison basis | Machine A | Machine B | Evidence source | Status | Sensitivity needed? |
|---|---|---|---|---|---|---|
| Acquisition/configuration | Same equipment boundary | — | — | Quotation/configuration | Documented / unresolved | No / Yes |
| Required accepted output | Same finished-product requirement | — | — | Trial, FAT, production data or agreed basis | Documented / assumed / unresolved | Yes if decisive |
| Staffing | Same operating boundary and shift basis | — | — | Staffing description / trial observation | Documented / assumed / unresolved | Usually |
| Labor rate | Same buyer-loaded cost method | — | — | Buyer data | Buyer input | As needed |
| Material loss | Same reject/rework definition | — | — | Trial or buyer production data | Measured / assumed / unresolved | Usually |
| Maintenance/spares | Same study period | — | — | Written scope / parts information | Documented / unresolved | As needed |
| Service responsibilities | Same support boundary | — | — | Written commercial terms | Documented / unresolved | As needed |
| Downtime consequence | Same buyer valuation method | — | — | Buyer scenario / production history | Buyer input | Usually |
| Other project costs | Same inclusion boundary | — | — | Quotation / buyer estimate | Documented / assumed | As needed |
The status column is as important as the value column. A buyer should be able to see immediately which inputs are documented, which come from internal operating data, which are assumptions and which remain unresolved.
This prevents an unsupported estimate from quietly carrying the same authority as a quotation, test record or buyer measurement.
Before the final ranking, check each decision-critical row with four questions:
- Are both machines being compared on the same definition?
- Is the cost entered over the same study period?
- Is the input documented, measured, assumed or unresolved?
- If it is uncertain, can that uncertainty change the preferred machine?
If the fourth answer is yes, that input deserves further validation before the economic conclusion is treated as robust.
A TCO model should therefore end with an evidence request, not just a total.
For a project-specific comparison, useful inputs include the finished product or case type, relevant size range, board and covering materials, accepted-output requirement, shift pattern, job mix and changeover frequency, current or expected staffing, material cost and waste data where available, shortlisted quotation scope, and any site, service or acceptance requirements that materially affect ownership cost.
With those inputs, the buyer can compare equipment on the conditions that actually matter to the plant—rather than allowing one headline purchase price or one unsupported savings claim to determine the decision.
Actionable Comparison Checklist
Before approving a machine on TCO grounds, confirm:
- The equipment/configuration boundary is the same.
- The study period is the same.
- Required accepted output is defined consistently.
- Rated speed has not been substituted for demonstrated or appropriately qualified production output.
- Labor figures identify the staffing boundary and operating basis.
- Buyer labor rates use the same loaded-cost convention.
- Waste, scrap and rework use the same definitions.
- Material-loss values are measured, documented or clearly identified as assumptions.
- Maintenance and spare-parts scope is explicit where it matters.
- Controls/software obsolescence and upgrade assumptions are documented where they could materially affect the study period.
- Service and warranty responsibilities come from written current terms.
- Downtime cost uses a buyer-defined scenario or relevant production evidence.
- Unknown values remain visible rather than being entered as zero.
- The same loss is not counted twice.
- High-impact uncertain inputs have been sensitivity-tested.
- Each decision-critical number is linked to an evidence source or assumption status.
Preparing a TCO comparison for a packaging-machinery project?
Bring the production requirement, materials, accepted-output target, shift pattern, expected staffing, job mix, quotation scope, material-loss data and service requirements into the comparison. These inputs make it possible to discuss machinery configurations without relying on generic ROI or labor-saving assumptions.
For project-specific equipment evaluation through Raymon Machinery, machine capability and commercial responsibilities should be confirmed against the selected HORDA-manufactured equipment, current documentation and the applicable quotation or order terms.