Earring box automation can reduce manual production work and improve manufacturing consistency, but its financial return depends on much more than the price or rated speed of a machine. A reliable investment assessment must identify which production steps will actually be automated, calculate the total installed project cost, determine realizable labor savings, and measure the number of acceptable finished boxes the production route can deliver.
There is no defensible universal equipment price, labor-saving percentage, or payback period for earring box automation. Box construction, materials, order volumes, operator assignments, changeovers, quality requirements, and remaining manual assembly operations can all change the result. For packaging manufacturers evaluating an investment, the objective is to determine whether the verified operating benefits justify the incremental expenditure within the required financial horizon.
Use this guide to decide how many paid hours the proposed line must actually eliminate to meet your payback target. Start with one representative earring-box SKU and price the scope that the trial can verify. Carry insert placement, closure checks and final packing as separate operations until the proposed line demonstrates them.
What Earring-Box Production Steps Are Actually Being Automated?
An earring box may use a wrapped rigid structure, a book-style opening design, a separate lid and base, or another packaging construction. The outer case is only part of the finished product. Depending on the design, the production route may also involve inner lining, decorative finishing, an insert that secures the earrings, hardware or closure assembly, inspection, and final packing.
For a representative trial, record pair spacing, post and backing clearance, insert retention and closure fit against the approved sample. A cover may pass visual inspection while the assembled pack fails one of those checks. Record both acceptable covers and accepted finished packs, with the reason for any difference. See the earring box equipment application guide for the sample details to bring to the trial.
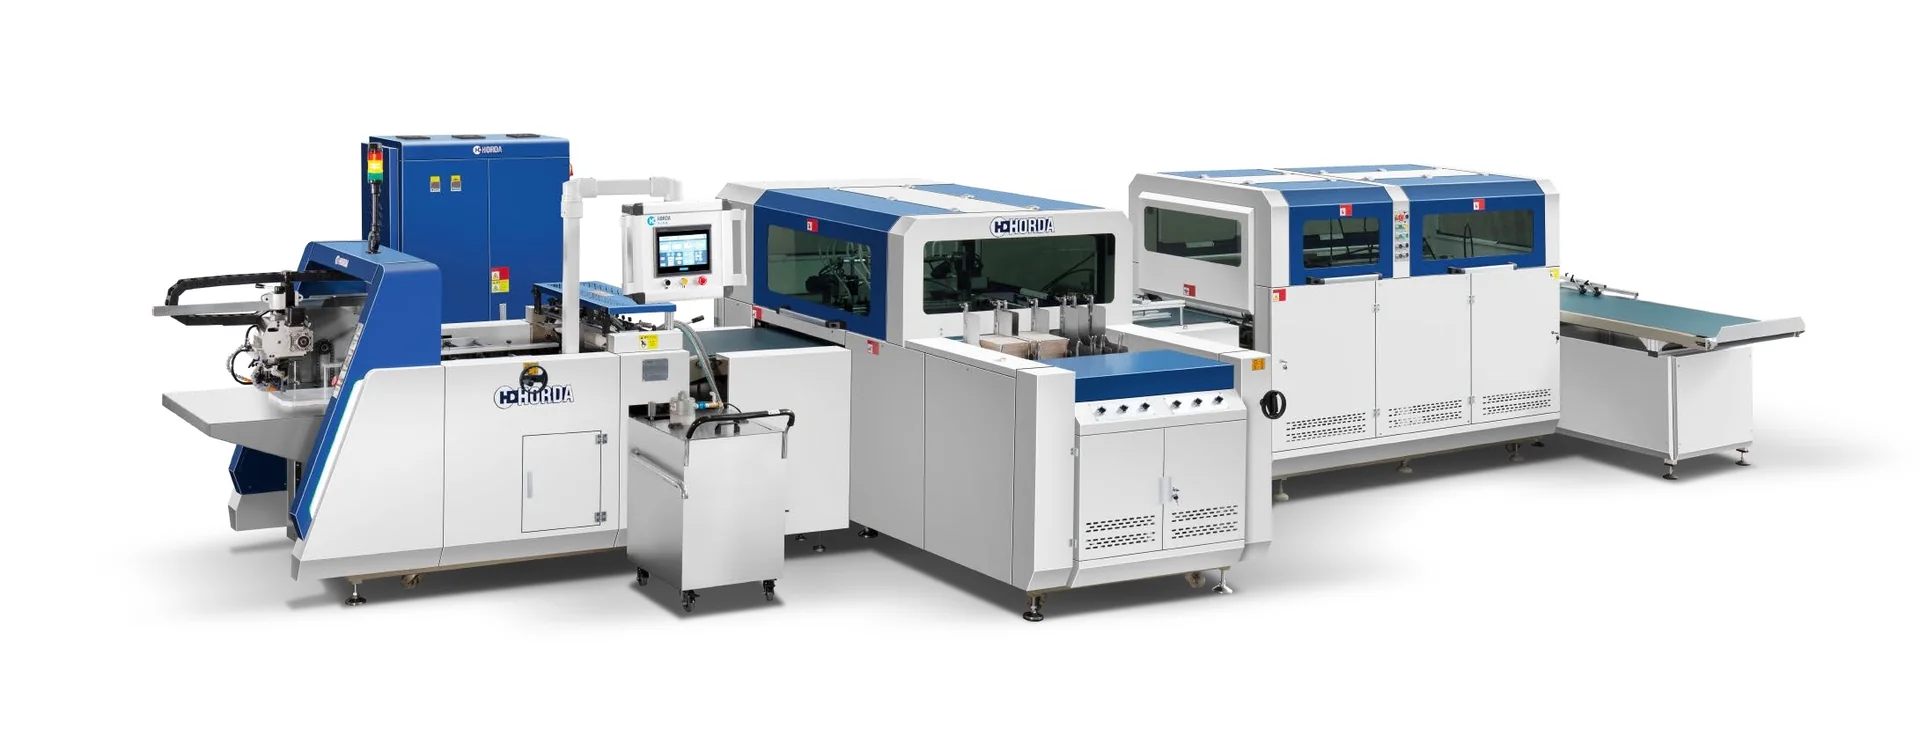
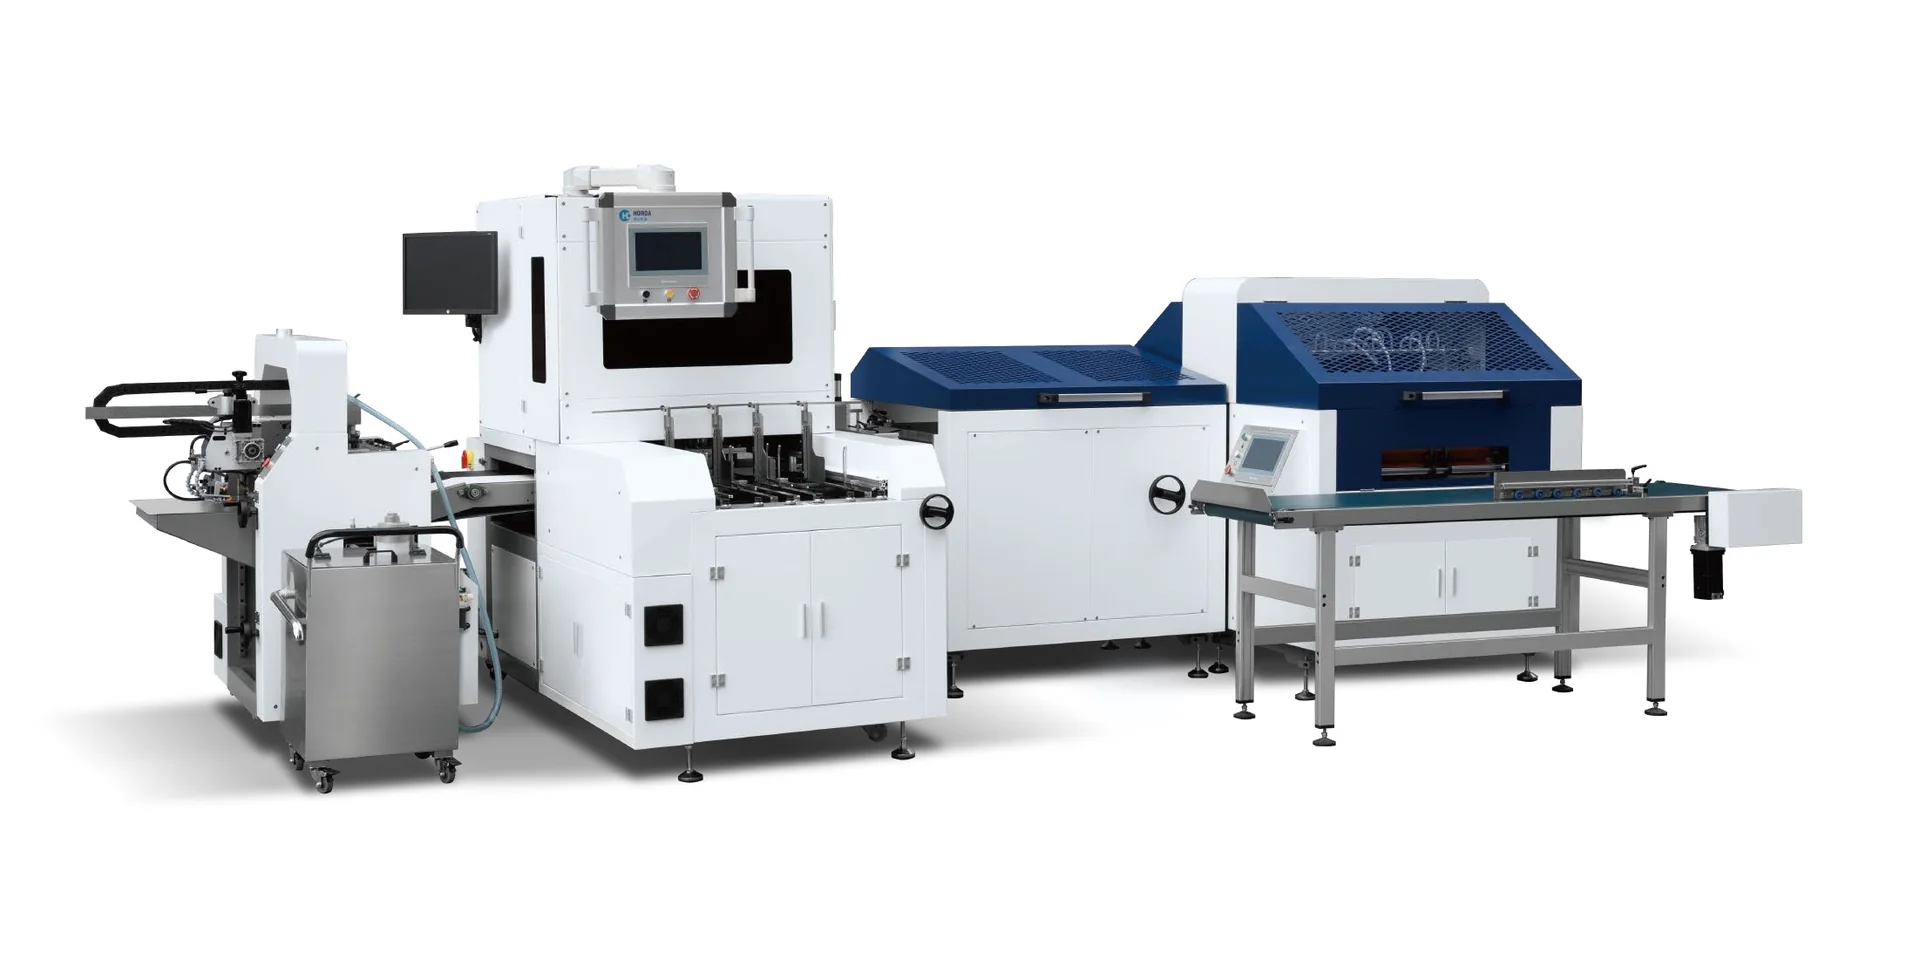
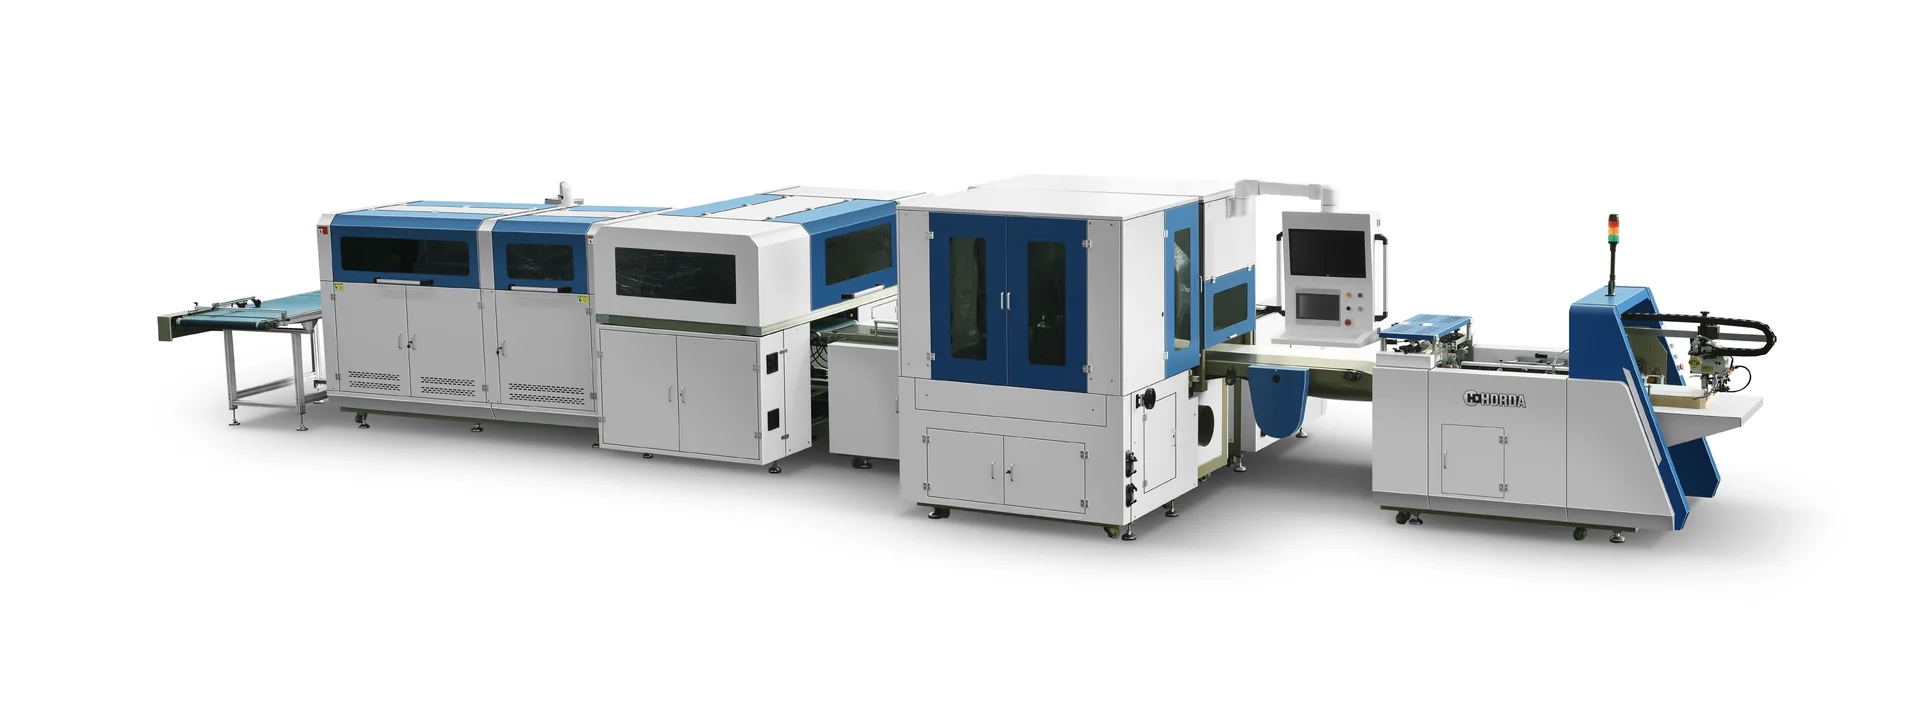
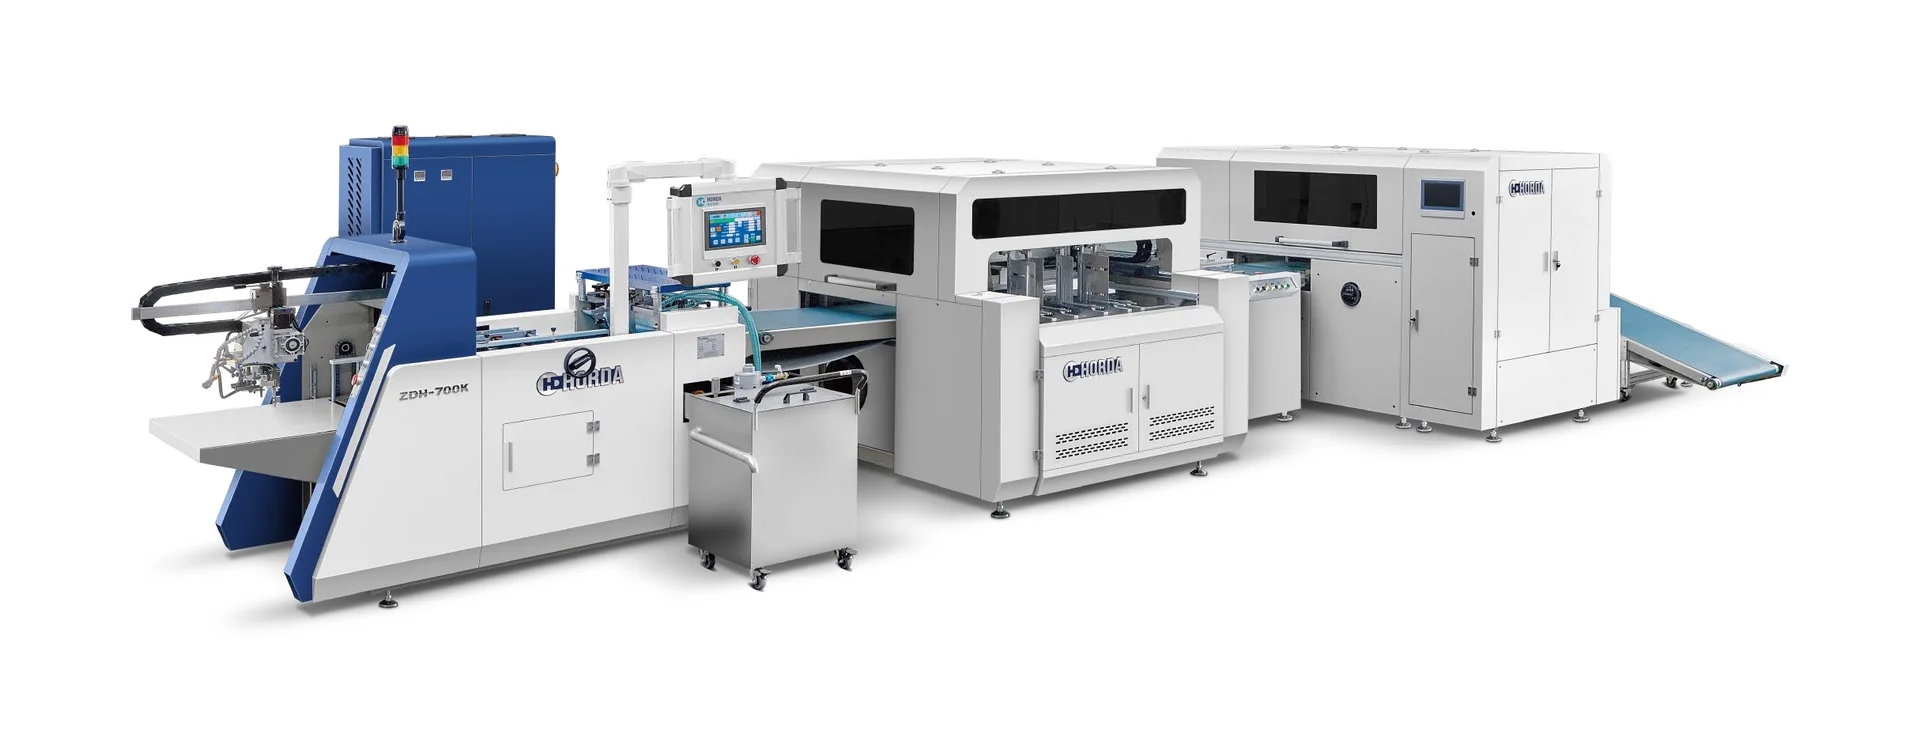
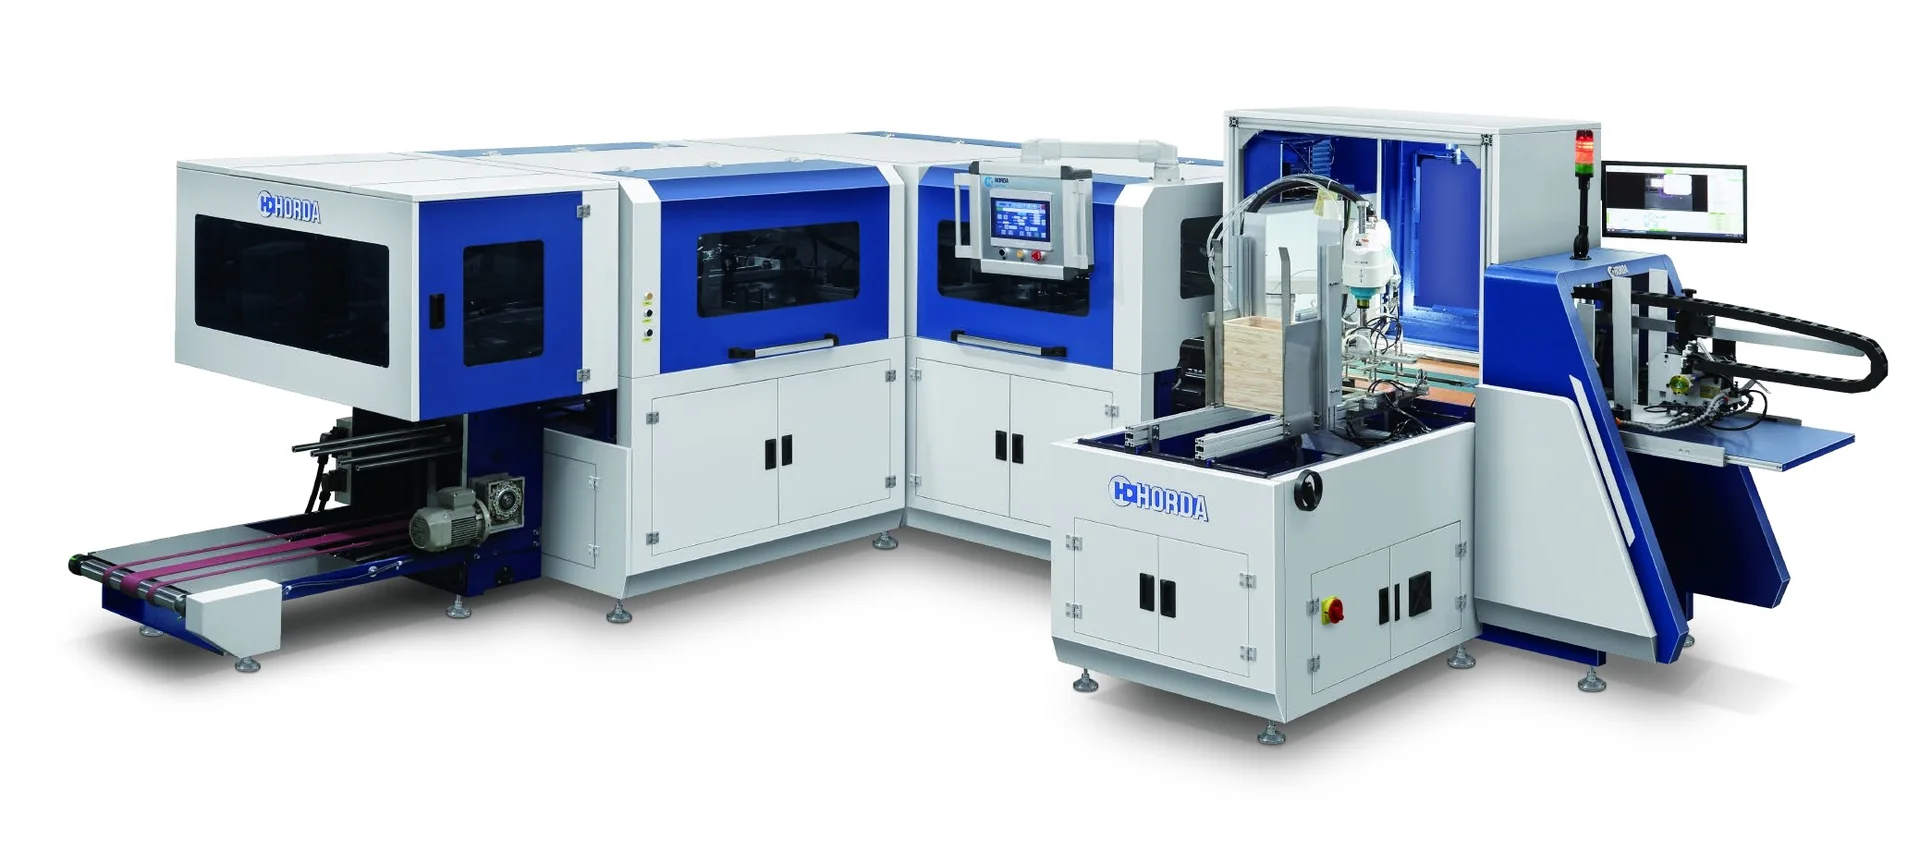
HORDA manufactures automatic case-making and inner-laminating equipment. Its documented case-making processes include board and covering-paper feeding, gluing, positioning, and edge wrapping. Certain case-making and inner-laminating configurations also connect cover production with the application of inner paper.
These are identifiable manufacturing operations. They do not establish that any particular machine can manufacture every component of a finished earring box.
Before evaluating the financial return, map the intended production route operation by operation.
| Production operation | Potential automation scope | What the buyer must verify |
|---|---|---|
| Board and covering-paper preparation | Relevant feeding and case-making operations may be automated in a suitable configuration | Flat dimensions, substrate properties, format limits, and feeding compatibility |
| Gluing, positioning, and case wrapping | Documented functions of applicable case-making equipment | Registration, wrap quality, finished structure, and material suitability |
| Inner-paper application | May be addressed by a compatible inner-laminating process | Liner material, adhesive, bonding requirements, and transfer between stages |
| Rigid-box forming or final case assembly | Separate forming or assembly operations may be required | Actual equipment scope and upstream/downstream interfaces |
| Earring insert preparation and placement | Not established as part of the case-making machine scope | Insert production method, placement work, fit, and manual handling |
| Final inspection and packing | May remain separate from machine production | Finished-box acceptance requirements and residual labor |
The distinction between a case-making process and a complete box production line affects both investment cost and labor savings. If the proposed machine automates outer-cover preparation while insert placement remains manual, the labor required for inserts still belongs in the automated route’s operating cost.
Equally, a machine that completes its own operation quickly does not necessarily increase finished-box output if the following assembly or inspection station cannot keep pace.
The correct starting point is therefore a representative finished earring box, its flat components, and a process map identifying which operations are included in the equipment proposal. Machine compatibility must then be checked against the selected HORDA model and its current documentation.
What Does an Earring-Box Automation Project Actually Cost?
The purchase price of the primary machine is only one element of an automation investment. The relevant capital decision is based on the total cost of establishing a production route that can manufacture the agreed product at an acceptable quality and output level.

A useful cost comparison separates initial investment from recurring operating expenditure.
| Cost category | What may be included | Required costing basis |
|---|---|---|
| Primary production equipment | Selected case-making or other applicable machinery | Current configuration-specific quotation |
| Optional modules and tooling | Format-related tooling, handling devices, lining or other agreed equipment | Itemized supplier proposal |
| Upstream/downstream integration | Feeding, transfer, collection, or connection with separately specified production stages | Confirmed project scope |
| Freight and site preparation | Transportation, utilities, floor-space preparation, and installation-related work | Written supplier and buyer estimates |
| Commissioning and training | Setup, trials, and agreed personnel instruction | Contractually defined responsibility and cost |
| Initial production preparation | Representative materials, trial consumption, and ramp-up expenditure | Project budget and recorded assumptions |
| Recurring operating expenditure | Energy, consumables, maintenance, replacement parts, and remaining labor | Measured or supportable annual estimates |
The table is a budgeting framework, not a statement that every HORDA machine is supplied with all listed components or services.
The precise quotation must establish which items are included, separately priced, excluded, or supplied by the buyer. Warranty, installation, commissioning, training, and after-sales responsibilities should be confirmed in writing rather than inferred from a manufacturer’s general product description.
For example, comparing a manual production cost against the price of a case-making machine alone would understate the investment if the proposed workflow also requires a separate lining stage and additional handling. Conversely, including unrelated equipment or existing factory overhead as new capital expenditure could overstate the project’s incremental cost.
The assessment should also distinguish capital items from annual running costs. A spare-parts package purchased with the machine may belong in the initial expenditure, while anticipated replacement consumables or scheduled servicing may affect the annual cash-flow model. The same cost must not be counted twice.
There is no verified equipment price for a specific earring-box automation configuration in the available manufacturer materials. A reliable quotation requires the box design, material specifications, proposed operations, production target, and installation conditions. Generic published machine prices cannot establish the installed cost of that project.
How Much Labor Can Earring-Box Automation Really Save?
Labor savings are often the most visible reason to investigate packaging automation, but they are also one of the easiest benefits to overestimate.
Three outcomes must be kept separate:
- Manual work content is reduced.
- Paid labor expenditure is reduced.
- Existing employees are reassigned to another productive activity.
All three can have operational value, but they do not produce the same immediate cash benefit.
Measure the work before estimating the savings
Start with the existing route and record labor time for the relevant production activities. That may include material preparation, feeding, wrapping, lining, component transfer, manual assembly, inspection, rework, and packing.
Repeat the assessment for the proposed automated route. Although a wrapping or lining operation may require less hands-on work, the machine can still need people to prepare materials, monitor operation, replenish supplies, perform quality checks, handle output, or support downstream assembly.
A useful comparison is:
Net labor hours released = baseline labor hours − automated-route labor hours
Both sides must represent the same accepted-product quantity, comparable product mix, and defined production period. Otherwise, the difference may reflect changing production volume rather than automation.
For an order mix containing several earring-box designs, the comparison should also account for the work involved in setting up and changing formats. Reducing labor time on one long run is not necessarily representative of a factory producing many short orders.
Convert released hours into financial benefit
A reduction in operator hours does not automatically mean the payroll cost falls by the same amount.
Consider a production route in which an operator no longer performs repetitive manual wrapping but remains employed to feed materials, inspect products, and assist with downstream assembly. The operator’s workload has changed, yet their wages may remain unchanged.
The financial effect depends on what the manufacturer actually does with the released capacity.
| Operational outcome | Financial treatment |
|---|---|
| Paid overtime is genuinely eliminated | Count documented avoided overtime expenditure |
| Paid hours or positions are actually removed from the cost base | Count supportable avoided cash employment costs |
| Employees remain on the same payroll but are reassigned | Do not automatically record payroll savings; assess separately whether the redeployment creates a measurable benefit |
| Released labor supports additional saleable production | Evaluate the verified incremental contribution rather than counting the same hours again as avoided wages |
For U.S. operations, the relevant labor rate should reflect applicable employer-paid costs, not simply an advertised hourly wage. The U.S. Bureau of Labor Statistics’ Employer Costs for Employee Compensation provides the general distinction between wages and benefits. An individual plant’s calculation should use its own payroll and employment-cost records.
The annual realizable labor benefit is therefore better expressed as:
Realizable annual labor savings = documented annual cash labor expenditure avoided because of the automation investment
A production manager may still consider labor redeployment strategically valuable. However, unless it avoids a separate cost or supports demonstrably profitable additional work, it should not be presented as equivalent to an immediate reduction in cash expenditure.
Why a manufacturer’s staffing illustration is not a project-specific result
A manufacturer’s production-line catalogue may illustrate a staffing arrangement or generalized cost-saving opportunity. Such information can help initiate a technical discussion, but it does not establish the savings achievable in a particular earring-box factory.
Actual results depend on the box construction, equipment configuration, supporting operations, shift organization, production demand, and the site’s existing labor efficiency.
A defensible labor-saving proposal should therefore show the baseline work study, expected residual work, proposed staffing plan, and the assumptions behind any claimed payroll or capacity benefit.
This approach is especially important when the equipment automates only one stage of a process that still includes hand assembly, insert placement, or decorative finishing.
Why Accepted Output, Changeovers and Scrap Matter More Than Rated Speed
A machine’s rated production speed describes a capability under defined equipment and operating conditions. It is not a measurement of acceptable finished earring boxes produced by the complete workflow.
For ROI purposes, the economically meaningful output is the number of finished boxes that meet the agreed quality requirements over a defined production period.
An appropriate starting measure is:
Accepted-output rate = accepted finished boxes ÷ scheduled production time
The measurement must state the product mix, time basis, and criteria used to accept or reject a box. Rework also needs its own record: a box accepted after correction may contribute to final saleable output, but the labor, material, and time consumed by the correction remain costs.
The bottleneck determines the production result
Consider a workflow in which an automated case-making stage produces covers faster than operators can install inserts and finish the boxes.
Even if the case-making equipment performs its operation consistently, additional covers may accumulate before assembly. Unless the downstream process is changed, the factory may gain work-in-process inventory rather than an equivalent increase in finished-box output.
The opposite problem can arise when material preparation or an upstream feeding stage cannot supply the automated equipment consistently. In that case, unused machine capacity may undermine the projected output benefit.
To establish an achievable line target, measure the capacity of each required stage under comparable conditions and identify the operation that limits finished-product flow. Transfer, handling, inspection, and rework should be included where they affect the result.
Changeover frequency changes effective capacity
Earring-box producers may handle different dimensions, coverings, structures, and decorative specifications across orders. The impact of those variations depends on the selected equipment and the actual job mix.
A machine with strong performance during a stable production run may achieve a lower average accepted-output rate when frequent adjustments and format changes interrupt production.
A useful record should distinguish scheduled production time, changeover time, unplanned stoppages, gross output, rejected output, and final accepted quantity.
The widely used Overall Equipment Effectiveness framework separates availability, performance, and quality losses:
OEE = Availability × Performance × Quality
As explained by the Lean Enterprise Institute, these factors provide a structured way to understand why equipment does not deliver its theoretical output.
OEE can help investigate machine-level losses. It does not, by itself, establish the accepted output of an entire earring-box line. If the financial model already uses measured accepted production, avoid applying the same downtime and quality deductions a second time.
Defects have both production and cost consequences
Registration errors, surface marks, poor wrapping, bonding defects, or other appearance and dimensional issues may lead to rejection or rework, depending on the box design and approved quality standard.
Automation could change the frequency or nature of such defects, but improvement should not be assumed without comparable evidence.
A meaningful before-and-after evaluation records the relevant defect categories, inspection basis, rework requirements, and cash cost of wasted materials and labor. It should compare equivalent products rather than crediting equipment with an improvement caused by changes in substrate quality, design, or inspection criteria.
These measurements connect the engineering result to the financial model. More accepted boxes may create additional contribution if demand exists. Fewer rejects may avoid cash costs. Neither benefit should be assigned an unsupported value or counted twice.
How to Calculate Earring-Box Automation ROI and Payback
The financial model should compare the incremental cash flows of continuing with the current route against implementing the proposed automated route.
The calculation starts with an installed investment amount and a defensible estimate of the annual net economic benefit. It then tests whether that benefit can recover the investment within the buyer’s chosen planning horizon.
Step 1: Establish the initial investment
Initial investment = machinery and equipment cost + project-related installation and integration cost + other relevant initial cash expenditure
The model should include any material initial working-capital or ramp-up cash requirement where applicable. Existing costs that do not change because of automation should not automatically be charged to the new project.
If a quotation includes optional equipment, distinguish the base proposed route from an expanded configuration. Comparing them separately helps identify whether the additional investment has a corresponding operational benefit.
Step 2: Calculate incremental annual cash benefit
A practical framework is:
Annual net benefit = realizable labor cash savings + avoided scrap/rework cash costs + contribution from genuinely additional saleable output − incremental operating cash costs
Each component must be compared against the same baseline.
The distinction between additional output and additional contribution is particularly important. Producing more covers does not automatically generate more profit if downstream assembly remains constrained or customers have not ordered additional finished boxes.
When additional demand is confirmed, use the incremental contribution after the associated variable costs, not the entire selling price as a benefit.
Likewise, scrap reduction should reflect actual avoided costs. If the additional contribution calculation already captures a particular improvement in quality or material utilization, that benefit must not appear again as a separate saving.
Operating costs can include changes in electricity, consumables, maintenance, and other cash expenditure attributable to the equipment. Any additional staffing, handling, or outsourced service expenses must also be considered where applicable.
Step 3: Calculate simple payback
When annual net cash benefit is reasonably stable and positive:
Simple payback (years) = initial investment ÷ annual net cash benefit
If cash benefits vary over time, use cumulative net cash flow to determine when the project actually recovers its initial expenditure.
A new production process may have a ramp-up period, different levels of utilization across seasons, or changing demand. In those circumstances, a steady-state payback figure can be misleading if it is presented as the actual recovery timeline.
If the model does not recover the investment within the required planning horizon, report that result rather than assigning a positive payback based on unsupported future benefits.
Step 4: Calculate defined-horizon simple ROI
For a chosen analysis horizon:
Simple ROI (%) = [(cumulative net cash benefits over the horizon − initial investment) ÷ initial investment] × 100
This is an undiscounted, cash-based ROI definition used for a transparent preliminary comparison. It is not the same as accounting rate of return, internal rate of return, or discounted net present value.
The evaluation should identify its horizon, included cash-flow categories, financing and tax treatment where relevant, residual value assumptions, and material exclusions.
The OpenStax discussion of payback explains the method’s limitations, while its net present value guidance addresses the timing and discounting of cash flows. A major capital investment may justify a more complete discounted cash-flow assessment.
An illustrative calculation—not a machinery performance claim
Consider a hypothetical earring-box production route in which case wrapping is automated but insert placement, final assembly, and inspection remain separate. Assume an all-in initial investment of $120,000, a five-year evaluation horizon, and no additional sales contribution: the downstream assembly station still limits accepted finished-box output. The amounts are illustrative assumptions, not a HORDA quotation, factory trial, customer result, or market price.
Suppose the change genuinely eliminates 1,500 paid labor hours per year at an assumed avoidable employer cash cost of $24/hour. It also avoids $5,000/year in scrap and rework cash costs, excluding labor already counted in the paid-hours saving, while adding $7,000/year in maintenance, energy, and consumables. Annual net benefit is therefore (1,500 hours × $24/hour) + $5,000 − $7,000 = $34,000/year. In a downside case, only 800 paid hours are actually eliminated; annual net benefit falls to (800 × $24) + $5,000 − $7,000 = $17,200/year.
| Hypothetical scenario | Annual net cash benefit | Simple payback | Five-year simple cash ROI |
|---|---|---|---|
| Base: 1,500 paid hours avoided | $34,000/year | About 3.53 years | 41.7% |
| Downside: 800 paid hours avoided | $17,200/year | About 6.98 years | −28.3% |
In the base case, five years of net benefits total $170,000. After the initial $120,000 investment, the undiscounted five-year net gain is $50,000, or 41.7% simple ROI. In the downside case, five years produce only $86,000 in net benefits, leaving a $34,000 shortfall and a −28.3% simple ROI; payback does not occur within five years.
Both examples assume the annual benefit begins immediately and stays constant. They exclude ramp-up losses, taxes, financing, discounting, changes in working capital, and residual value. If workers are only redeployed and paid hours do not fall, the labor cash-saving line must be reduced accordingly. The exercise shows why verified staffing changes matter more to ROI than a faster case-making cycle alone.
How many paid hours must actually disappear?
Use the same hypothetical inputs to set a trial decision threshold. A five-year simple payback on $120,000 requires $24,000 in annual net cash benefit. With $5,000 in avoided scrap and rework and $7,000 in added running costs, the labor portion must contribute $26,000 a year. At an assumed $24 per avoidable paid hour, that is about 1,084 paid hours a year, rounded up. These are calculation inputs only. Replace every value with your quote, work study and payroll evidence.
Time cover making and insert placement separately on the same sample set before and after the proposed change. Record who does any remaining handling, corrections and inspections. For each SKU, subtract the after-trial operator-minutes per accepted pack from the baseline. Multiply that difference by annual accepted-pack demand and divide by 60 to estimate released hours. Add the results across SKUs. Count only the released hours that the staffing plan can convert into avoided paid hours. If the result falls short, test a smaller equipment scope, a different downstream arrangement or a lower installed cost before approving the investment.
Step 5: Test the assumptions most likely to change the decision
The base calculation should be accompanied by sensitivity analysis. This is not about applying an arbitrary optimistic or pessimistic percentage. It is about identifying which operating assumptions are both uncertain and economically important.
| Variable | Potential impact on the business case | Evidence needed |
|---|---|---|
| Annual production demand | Determines whether additional capacity can be sold or used economically | Confirmed order demand and production plan |
| Realized labor savings | Determines how much released work becomes avoided cash expenditure | Staffing, payroll, and overtime changes |
| Product mix and changeovers | Changes average usable production time | Representative production records |
| Accepted yield and rework | Affects saleable output and cash costs | Comparable quality and rework records |
| Downstream capacity | May prevent the factory from realizing faster machine output | Whole-route capacity measurement |
| Installed project cost | Changes investment recovery requirements | Itemized project quotation |
| Incremental operating cost | Reduces annual net cash benefit | Utilities, materials, maintenance, and labor estimates |
A convincing investment proposal should still be understandable when its most optimistic assumptions are replaced with measured or conservative alternatives.
The objective is not to produce a high ROI number. It is to identify the conditions under which the economic conclusion remains credible.
When Does Automation Make Financial Sense—and When Should You Wait?
Automation may be worth serious consideration when the factory has a repeatable production route, sufficient demand, measurable manual work content, and a technically suitable configuration that can maintain the required quality.
However, the attractiveness of the investment changes when one of these conditions is absent.
| Production or investment condition | Likely decision implication | Appropriate next action |
|---|---|---|
| Stable demand, repeatable formats, and substantial measurable work content | Automation may offer a clearer basis for recovering investment | Complete the configuration-specific technical and financial evaluation |
| Several box designs with uncertain changeover and material behavior | Output and quality assumptions may dominate ROI uncertainty | Conduct representative format and material trials |
| Faster case-making but unchanged downstream assembly capacity | Complete-box output may remain constrained | Evaluate the entire production balance before counting capacity benefits |
| Released operator time without lower payroll or profitable additional work | Labor productivity may improve without equivalent cash savings | Recalculate the business case using realizable benefits |
| Uncertain machine compatibility or incomplete sample requirements | Both cost and output projections remain speculative | Confirm suitability before committing to an ROI figure |
| Limited confirmed demand or a materially negative downside scenario | Investment may not recover within the required horizon | Defer, revise scope, or reassess after better demand and production evidence |
An important option is to evaluate the production route in stages. For example, a manufacturer might investigate automation of a clearly defined cover-making operation before committing to a broader linked system.
That is an evaluation strategy, not a recommendation that a particular HORDA model or partial configuration is suitable for every earring-box manufacturer. The appropriate route depends on real samples, process interfaces, investment conditions, and the intended finished product.
The decision can also change as demand develops. When production volume is uncertain, the economic value of unneeded capacity may be low even if the machine can technically achieve a higher rate. When accepted output is constrained by repetitive manual work and confirmed sales demand exists, removing that constraint could become more valuable.
A defensible decision therefore links technical suitability with an evidence-based financial threshold set by the buyer, rather than relying on a universal production-volume or payback rule.
What to Send for a Quotation and Performance Trial
A quotation for earring-box automation is more useful when it can be evaluated against the same assumptions used in the ROI model.
Before requesting a configuration, prepare representative product information and a clear description of the current and intended production routes.
Product and material information
- Finished earring-box samples and relevant construction drawings or dielines.
- Complete flat dimensions and finished dimensions for each representative format.
- Board type and thickness (mm), covering-paper basis weight (g/m²) and finish, other surface materials, and adhesive requirements.
- Inner-lining construction, insert materials, decorative requirements, and closure or assembly operations where applicable.
- Defined appearance, registration, bonding, dimensional, and functional acceptance criteria.
The intent is to establish what must be manufactured, not simply provide a finished external size.
Production and economic information
- Current manual production stages and available labor-time records.
- Actual accepted finished-box output by shift or other defined production period.
- Required order volumes, production schedule, product mix, and changeover frequency.
- Existing reject and rework data, with consistent quality definitions.
- Target accepted-output capacity, operator and floor-space constraints, and available utilities.
- Destination and requested equipment, installation, commissioning, and service scope.
- Labor cost, operating-cost, and investment-horizon assumptions needed for the financial calculation.
These inputs allow the technical proposal and the business case to use the same production definition.
Define the trial around the real investment risk
Where a representative sample trial or factory acceptance test is proposed and agreed, its scope should address the assumptions that materially affect the purchase decision.
The buyer and responsible supplier should establish the sample formats and materials, production operations to be demonstrated, measurement period, changeover conditions, output recording method, and quality criteria before interpreting the results.
The trial record should distinguish machine-stage output from acceptable finished-box output. If insert placement, final assembly, or packing is not included in the proposed equipment, the buyer must measure or estimate those stages independently.
A useful trial record identifies:
| Trial evidence | What it establishes |
|---|---|
| Process and configuration tested | Which parts of the proposed production route were actually demonstrated |
| Representative formats and materials | Whether the observations apply to the intended order mix |
| Gross and accepted output | The usable production result under the tested conditions |
| Changeover and downtime record | Losses that affect sustained output |
| Quality and rework record | Whether the resulting product meets agreed acceptance criteria |
| Labor and material-handling observations | Which manual activities remain |
| Written deviations and limitations | Which assumptions still require resolution |
These are recommended buyer-side verification items. They are not a claim that every HORDA configuration includes a particular test procedure, sample quantity, test duration, or contractual performance guarantee.
When all the necessary information is available, the proposed machinery, operating plan, and financial model can be evaluated together. If critical assumptions remain untested, they should stay visible as risks rather than being replaced by optimistic estimates.
The next step is to obtain a configuration-specific proposal. Buyers can submit representative earring-box samples, material specifications, the intended production route, and required accepted output through Raymon Machinery’s equipment quotation channel.
Raymon Machinery presents equipment manufactured by HORDA. Exact machine suitability, pricing, technical acceptance criteria, and commercial responsibilities must be established through the current product documentation and written project proposal.
For earring-box manufacturers, the strongest automation investment case is not the one with the highest advertised machine speed or the largest assumed labor reduction. It is the one that connects a verified manufacturing process to measurable accepted output, realizable cash benefits, and a recoverable total investment.